Ogre Animation is finally shaping up.
There’s a lot to do, namely:
- Add TagPoints
- Add NEON support
- Document & samples
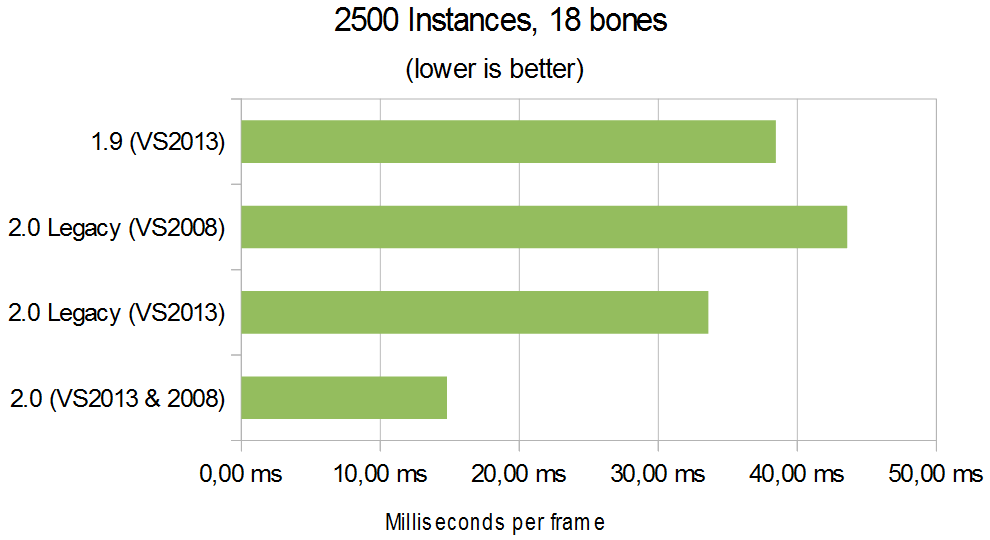
I have to say I’m glad to see that the new animation component is 2x-3x faster and is able to use 60% of the CPU cores (out of a quad core machine), thus running 2500 animated instances at 60 fps.
However I must say I’m a bit disappointed. I was expecting more. Furthermore at first I disabled SIMD and it seemed to give a few extra ms, which infuriated me (you don’t know how many days I spent thinking about how to make this Simd friendly). But that turned out some obscure bug (that I have yet to hunt) caused the C version to not update the shadow maps, and that was the cause of the ms bump. After disabling shadows, the performance difference between the C version and the SIMD version was negligible.
Bandwidth limited
I tried a lot of stuff to improve performance but all I got was placebo gains. So I fired VTune for Linux and noticed very high CPI count (basically, the CPU was waiting for data to arrive). I proceeded to remove many of the matrix concatenations and just leave transfers to go by. The look was of course all screwed, but the performance was exactly the same. It was pretty obvious to me the problem was that I was severely bandwidth limited. Unfortunately I had to use matrices because the community was asking for non-uniform scaling.
Considering we’re processing 5 matrices per bone (that’s insane! I wonder if it cane be improved?! one for the object’s world space, one for the parent bone, another for the bone in object space, another for the bone in “world-bone” space aka what we send to the shader, and another for the inverse bind pose used to transform from object space to world-bone)
The robot mesh has 18 bones (actually SIMD can process in this case up to 28 without any degradation due to how the algorithm works), 2500 instances at 60hz; That’s 4x4x4x5x28x2500x60 = 1.25 GB/s (not to mention resetting bones to default pose + sending to GPU, etc). Note that some of that data (i.e. the parent’s bone) is shared across many bones, thus should be hot in the cache. Still, that’s a lot of bandwidth for a PC. Spamming prefetch at the locations with high CPI helped drastically reducing the CPI ratio, and improved performance by 4%
I still think I’m missing something though. It hasn’t “clicked” yet. And I haven’t tried all of the approaches, but time’s up; I’ve got to focus on something more important (getting 2.0 into release state).
Compiler bug report, VS2013 generating much faster code (specially for C)
I was so thorough with the analysis of the Animation code that I even spotted inefficient code generation from the compiler and ended up submitting a bug report.
Something that took me by surprise, is that VS2013 is much better at producing the C code. The gap between C and SSE2 is diminishing. Though it could be due to bandwidth limitations, or VS still having room to improve on SSE2 code generation.
The improvement is large enough to acknowledge that when using VC 2008, OgreAnimation is 3x faster than legacy animation, but when using VS 2013; OgreAnimation is a bit more than 2x faster than legacy.
BENCHMARK!
|
2.0 (VS2013 & 2008) |
2.0 Legacy (VS2013) |
2.0 Legacy (VS2008) |
1.9 (VS2013) |
|
14,80 ms |
33,60 ms |
43,59 ms |
38,46 ms |
|
1,00x |
2,27x |
2,95x |
2,60x |
A few considerations:
- The conditions of the benchmark haven’t changed much so I won’t repeat. Perhaps it’s worthwile noting that now I’ve got 8GB of RAM (4x2GB), running at 333Mhz 5-5-5-18 instead of the previous 4GB @400Mhz 6-6-6-18
- These numbers come from the HW VTF instancing technique, which is the best one.
- Ogre 1.9 wouldn’t process animations if the animation didn’t change (i.e. “walk” is active but is paused). Ogre 2.0 will always update. As a result, 1.9 is faster when the checkbox “Animate Instances” is off.
- Ogre 1.9 applied frustum culling before updating the skeletons. Thus, if you look away from most of them, 1.9 will be much faster than 2.0
- Ogre 2.0 “legacy” has exactly the same system as 1.9 except that it always updates and doesn’t frustum cull, thus it often performs the worst. It was included to compare 2.0 against itself, as well as with the “on top condition” 1.9
- Something not benchmarked is that Ogre 2.0 has per-bone weights for free, whereas in legacy it takes a slower code path. Also improved features for TagPoints and easier third party IK integration are planned
Perhaps the biggest criticism that I can foretell is that Ogre 2.0 doesn’t frustum cull the skeletons and still updates if the animations are paused. The reasons for this are:
- Frustum culling at fine granularity conflicts with DOD (Data Oriented Design) paradigms, and thus reduces the overall performance when looking at most of the skeletons (which is most likely the general case). Furthermore fine frustum culling is useless in modern real world applications where there are like +4 camera passes (reflections, shadow mapping) as eventually everything ends up getting caught by the camera. Also some games need to get the skeleton data for collisions or logic, despite not being on camera (i.e. RTS games). A coarser frustum culling (called High Level Culling) will come in future versions of Ogre to deal with extremely large worlds where this matters. Additionally, it can cause glitches with tagpoints and very large skeletons (because they get culled when they shouldn’t)
- Not updating while animations are paused introduces overhead that conflicts with DOD paradigms too, and honestly is not a real scenario at all. Rarely a game or simulation contains thousands of skeletal animated objects having their animations paused.
Code and reproducing results
As always, the binaries to repro the results. I’m very interested in hearing your results. Most likely it will scale with your RAM’s bandwidth and your cache size. Additionally, the CPU core usage was very high (60% out of 4 cores) and Core i7 & i5 have a history of scaling better on Ogre 2.0 than the Core 2 family; so may be your results are even better than mine.
- Precompiled Pack: Yosoygames Mirror, Mediafire Mirror
- Source Code
Beware of the following:
- HW VTF is the best technique for everything (except may be when instances are not animated).
- In 2.0, the SW VTF technique doesn’t work, “No Instancing” technique still uses legacy (in ALL versions), and “HW Basic” technique doesn’t support animation, thus it’s not suitable for benchmark.
- For those who are not aware of Ogre techniques, the technique called “Limited Animation” aka LUT (short for Look-up-Texture) is not miraculously faster than the rest. It’s a trick, more like cheating, for rendering large crowds where skeletons are reused by multiple instances, thus giving the appearance that they’re unique.
- Settings are saved in your Documents folder, under the “Ogre” folder.
- When compiling Ogre src, you have to untick the CMake option “OGRE_LEGACY_ANIMATIONS” in order to use the new system, which is ticked by default (btw. some components, like RTSS don’t compile yet while this option is unticked)
On my system, with moving and animated, hardware vtf, default camera position:
– 2.0 legacy is 16ms
– 2.0 new is 3.8ms
Nice. 🙂
(That’s the 2013 binaries. The 2008 ones gave 4.4ms)
4x? great! forgot to mention the camera was looking at all objects, but still the frame rate doesn’t improve much when looking away (except for 1.9 where the variance is way too high)
I’m surprised your system is performing waaaay better than mine, I wonder what’s the reason
I only ran the 2008 binaries because I’m missing a dll for 2013.
2.0 legacy 34 fps
2.0 after 106 fps
Very nice indeed!
This is with moving, animated, hardware VTF, and the camera pulled back so everyone is visible.
My machine is an old quad-core Xeon X3450 (2.67GHz) with GTX 570.
Are these binaries the SIMD version or the C version? I’m surprised SIMD made so little difference!
Great work nevertheless!
These binaries are SIMD (however 1.9 & 2.0 legacy didn’t use an SSE implementation, they did use a bit of SSE for some matrix concatenation, and that was included and enabled)
The missing DLLs are probably part of the “Visual C++ Redistributable Packages for Visual Studio 2013”:
http://www.microsoft.com/en-us/download/details.aspx?id=40784
Ok, new times with the camera moved back so all 2500 robots are visible with hardware+vtf. (And a newer geforce driver, to hopefully fix glitches in Splinter Cell Blacklist):
2.0 legacy: 15.25ms
2.0 new: 4.38ms
In 2.0 new I got around 7ms with the default shader based system, but 4 robots were corrupt.
http://img24.imageshack.us/img24/236/6luh.png
The legacy version doesn’t do that.
4 corrupted robots is exactly the size of a batch (for shader based), which is suspicious. May be it’s a multithreading issue, your number of cores (excluding HT) was 8, right?
12 virtual cores (hex core i7 with hyperthreading on)
Looking at it closer, it’s not 4 robots. There’s one robot sitting at the very centre (0,0,0 I’m guessing) that doesn’t animate or move with the others, he’s just frozen. Four of his bones are off at the edge of the area where 4 robots should be (the last 4 by the look of it).
Or maybe all 4 missing robots are rendered at 0,0,0 on top of each other and each has only a single bone moved to the right position.
The corruption doesn’t happen when the grid size is 28×28 or lower. As soon as it reaches 29×29 it appears.
http://img571.imageshack.us/img571/2315/zinb.png
The shadows have some issues too, only a bit over 25% of the robots have shadows (as the pic above also shows). The Enable Shadows button also doesn’t do anything. (Not that that’s the point of this of course, it’s an animation speed test)
Hi!
Mmmm, 6 cores. That could be the reason. I’m going to try using 6 threads to see if I’m missing something.
About the shadows. Yeah, I know.
The reason it “looks bad” it’s because it’s actually a spot light (not a directional light) and hence not all objects would be in its shadow.
It flickers because the receiver’s shader should be clamping everything outside the cone but IIRC it’s not doing that, so it just samples out of the shadow map texture and then wraps or clamps.
The original idea of using a shadow setup was to showcase how performance is affected when shadow mapping is enabled, because an additional pass is needed, and instancing vs non-instances becomes most noticeable the more passes you have.
When shadows are disabled, the shadow map is still being used hence giving the appearance that “it doesn’t work” but in fact you’re disabling that second pass (framerate does indeed go up) and the shadow map is no longer updated.
From an eye-candy perspective looks broken, but functionally it’s doing what is intended (showcasing performance in different, user-tweakable scenarios).
I’ve been discussing with Murat over this, the problem currently w/ our samples is that they don’t tell what you should be looking at (or what the sample is trying to prove). I like Havok’s approach, where:
a. Their demos always display a small help text upon loading it, explaining what you should be looking at (and sometimes what you should ignore), which goes off after a few seconds.
b. They separate their demos into mainly 2 categories: “API usage” (which is a blend between tutorial and benchmark, but more tutorial than anything else) and “Use case” (benchmark real usage in different conditions or just showcasing eye-candy or fun stuff)
HW + VTF & 2500 instances visible & move + anim + shadows (VS2008)
2.0 legacy: 28ms
20. new: 14ms
BTW: If I set the robots to not move, disable the animations and set the “static” checkbox, the performance degrades slightly (from the 14ms to 18ms). I would have assumed the opposite?!
PS: I don’t have the visual glitch Kojack reported (quad-core here).
For VS2013, the “after” number stays basically the same, but the “before” drops from 28ms to 22ms.
It’s been a while since I don’t check that. The skeletons are still processed for sure, which take a lot of time. May be something else is also still being processed.
Edit: Ahhh, I’m guessing, but I think I know what’s going on: When setting to static, a different set of batches for the InstencedEntities need to be constructed. If the old (now unused) batches aren’t being cleaned, they will take away CPU time. And if their instances weren’t destroyed, they will also waste time doing unused skeletal animation.
Hitting the “Defragment Batches” does not change anything (not sure if it should, but sure sounds like it from your “EDIT” comment). If it is going to become an official sample, this cleanup thing should be solved to showcase the proper best-practice.
I also noticed now, that quite often the SampleBrowser crashes when trying to switch to “static”. Might try to investigate further once I find the time.
Hi Matias! I asked Bruce Dawson, Valve developer who himself had success in reporting VS codegen bugs (and as a result getting them fixed) to take a look at your MS Connect bug report and here’s what he said:
“I took a quick look at the bug report. It might be good adding comments explaining the implications of using movdqu versus movaps. If you can somehow measure the performance impact of the difference (comparing the generated code to assembly language using the code the compiler should generate) then that would be ideal. The first levels of compiler bug triage may be developers who are not expert in the performance implications of SSE assembly language. If you can make their job easier you may have better luck.”
http://randomascii.wordpress.com/2013/12/31/bugs-i-got-other-companies-to-fix-in-2013/#comments
Thanks a lot, I will!