Debugging on Linux sucks. Let’s try to make it suck a little less.
I was debugging a bug in Ogre, and after giving up with Linux, in MSVC the issues came up almost instantly after looking at this screenshot (note the bug has been fixed in this shot):
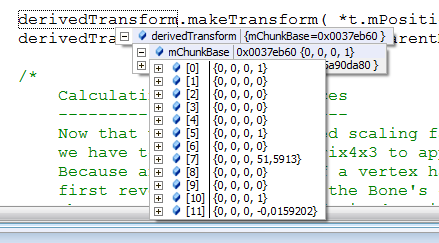
With a single mouse hover I was looking at 48 numbers at once. Of course this may not seem useful if you don’t know how to read it, but if you do; numbers that are out of place will appear in no time. For example this picture is telling me that except for object 0, objects 1, 2 & 3 have null matrices. So unless there is just one object, derivedTransform.makeTransform didn’t work correctly.
By the way, Object 0 is at position (0, 51.59, -0.0159), unit scale, no rotation. One picture, so much information.
In Linux, every GUI show these numbers in a pretty useless way. There’s no way I can visualize them all at once or retain enough information to imagine what’s going on.
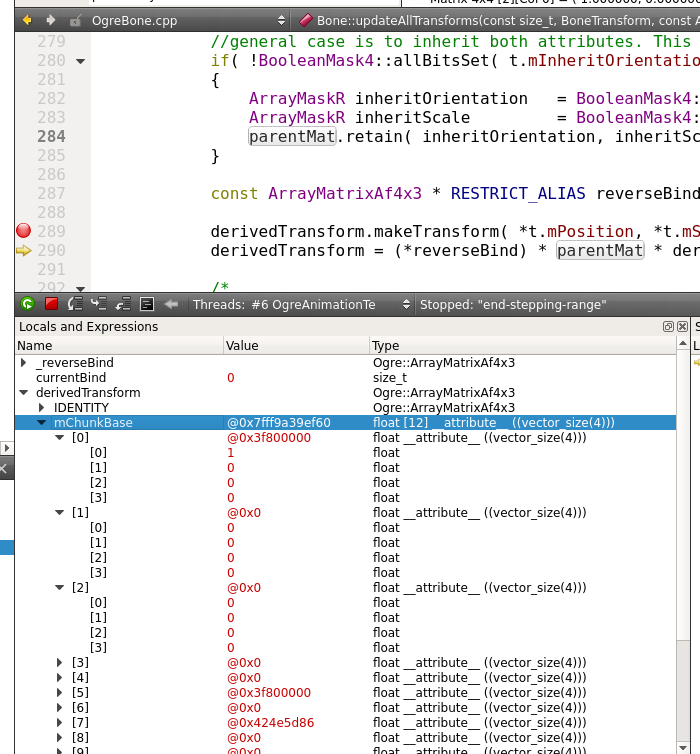
How am I supposed to quickly look at that?
But then I was introduced to GDB pretty printers, which unfortunately, the manual is very bad.
Trying out pretty printers.
The situation is pretty lame. Every GUI treats the output format differently and there is no standarization in how the data is displayed.
- Qt Creator ignores them (it uses their own interface called “data dumpers”), but they will show up if you type “print derivedTransform” in the Debugger Log (which is hidden by default, go to Windows->Debugger Log). I actually can live with that, but if you use the “right way” of outputting the pretty printers, the format is extremely verbose to the point it’s useless. Fortunately I found a workaround.
- KDevelop works almost like intended. If I use the py interface ‘to_string’ it shows up nicely and exactly as I want, but there is no way to hide it when you don’t need it. ArrayMatrix4 can take a lot of space. If I print using the ‘children’ interface (one for each) then KDevelop starts ignoring the to_string method, and starts hiding the important data again.
- Eclipse and Nemiver don’t respect end of lines. They show the escape character instead. i.e. “Data[0]\nData[1]”. Ugly. That rules out the ‘to_string’ interface. Using the ‘children’ interface works, but starts having the same problem as KDevelop (the relevant data is hidden behind too many children in the hierarchy)
- Additionally, Eclipse said the inl files couldn’t be loaded (showed up assembly instead) even though the path it claimed it was looking for was correct.
- Console GDB debugging is the only place where I could fully control how the data is displayed, but then I loose all other goodies needed to productively spot issues. It’s a very bad sign when using the command line is several times superior to using an IDE.
- Code Blocks… ugh, it’s not even…. I mean… what kind of debugger doesn’t allow launching debugging sessions from a foreign application? Why do I have to attach, and why do I have to magically know the pid of my process (which I have to put to sleep and act fast). Even after managing to do that, the debug display was plain disappointing. Also where are the hotkeys for single stepping? My god.
- KDevelop & Qt Creator were much more forgiving to honest mistakes in the embedded source file paths compared to Eclipse, Nemiver and Code Blocks (I just want to debug the damn code and continue coding, not spend my time setting up paths “the correct” way).
KDevelop worked
KDevelop along with Qt Creator were the best debuggers (considering other issues I’m not mentioning).
When it comes to pretty printing, like I said, using to_string interface in KDevelop worked almost exactly as I wanted, so here’s my pretty printing interface. Copy-paste the content into the .gdbinit file in your home folder and it should work.
Note that pointers won’t work. If you’ve got a pointer, you have to dereference it, i.e. add “*mPosition” to the watched variables, instead of “mPosition”
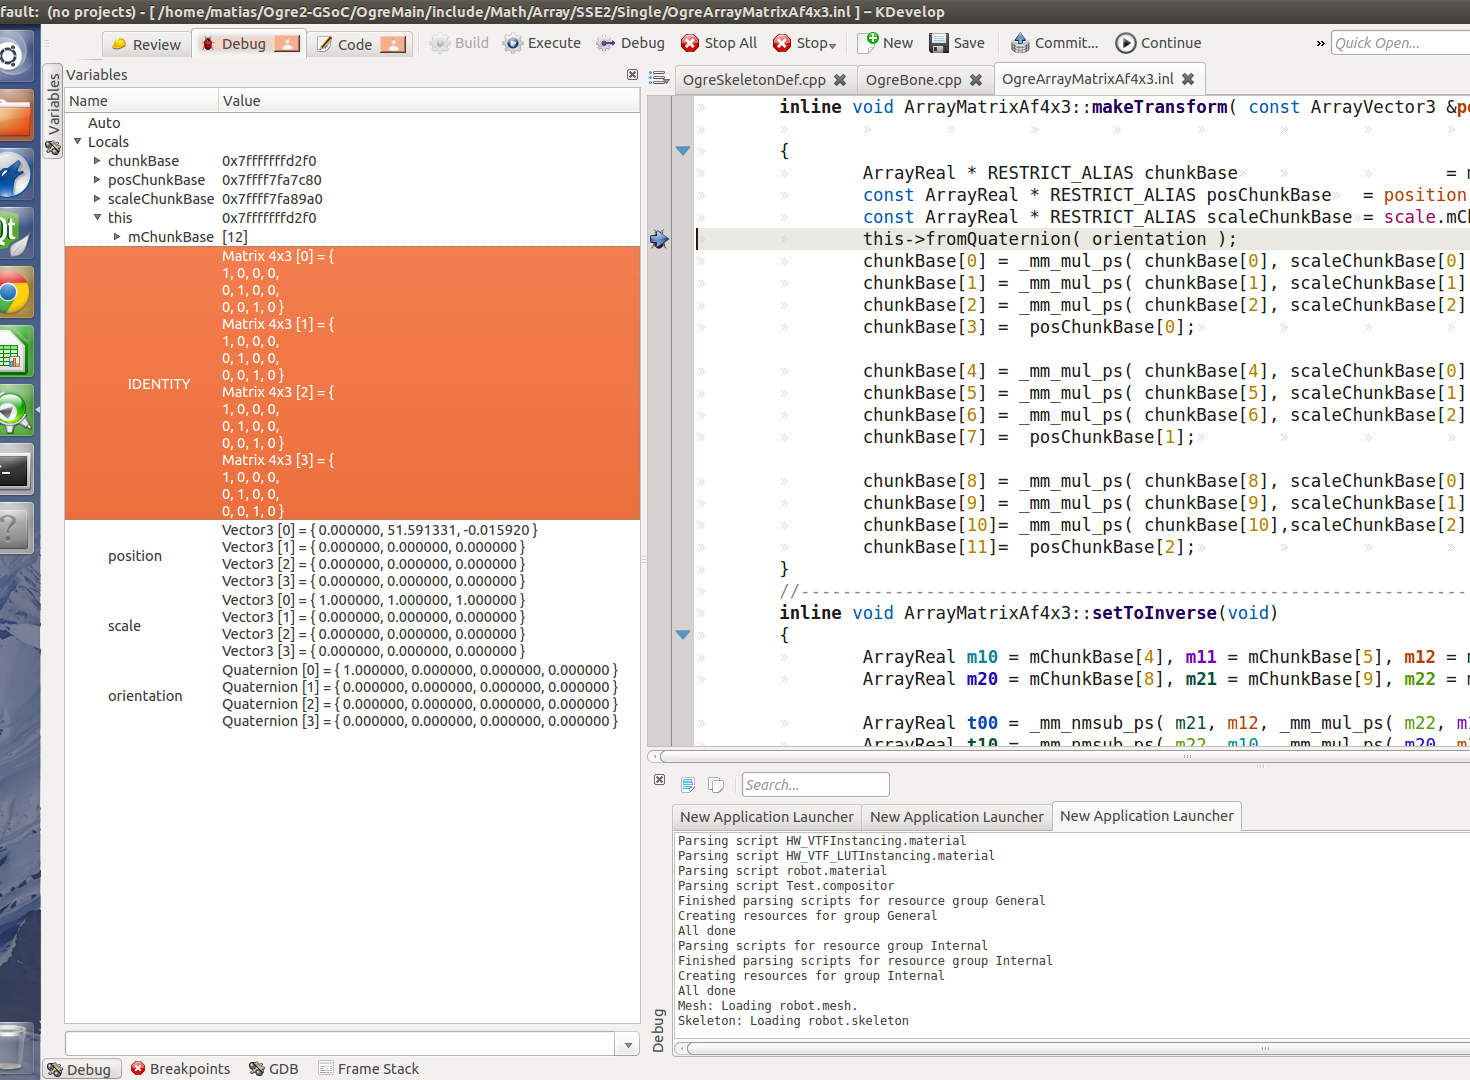
The output takes a lot of space, but it’s very nice and clear. May be even better than MSVC (though KDevelop still has many flaws in other areas)
Qt Creator worked
Forget about pretty printing in the “locals and variables” window you won’t get that, and refer to the Debugger Log window. Type ‘print derivedTransform’ (no quotes) and it will work. I’m used to this since the watch window in MSVC often requires me to type these kind of things.
I had to use a special version of the children interface that all other IDEs interpret as char* (which makes them ugly to display) but it’s the only way I found to get decent output in Qt (the Debugger Log also shows escape characters instead of obeying them, and they surround every line in quotes, and use excessive lines for each expression).
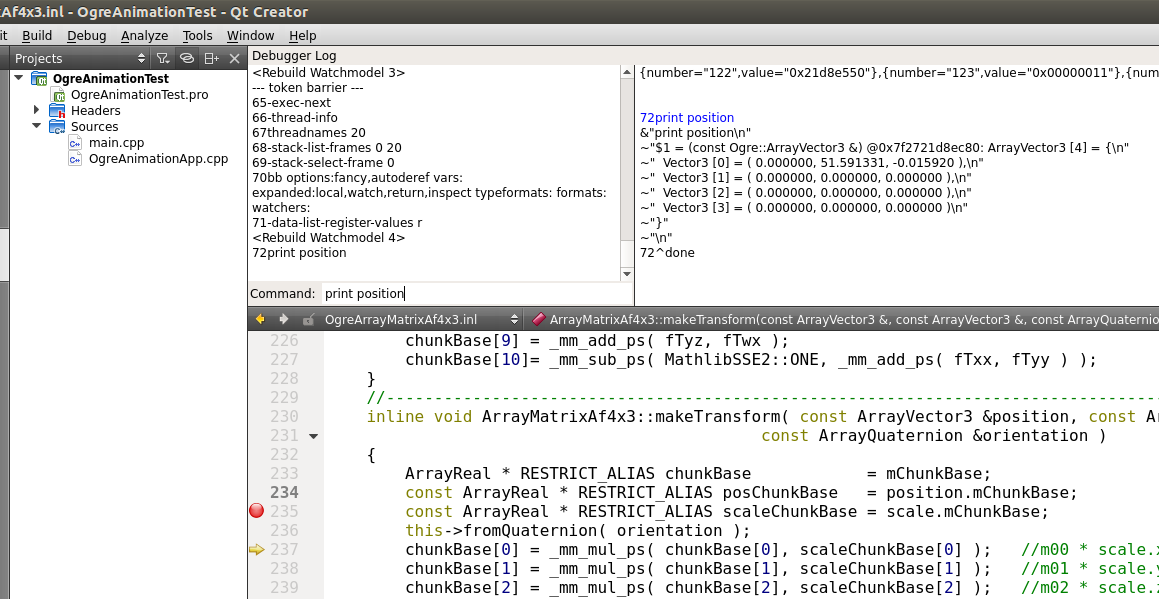
Look at the Debugger Log, also pretty formatting. It was a PITA to get it to work.
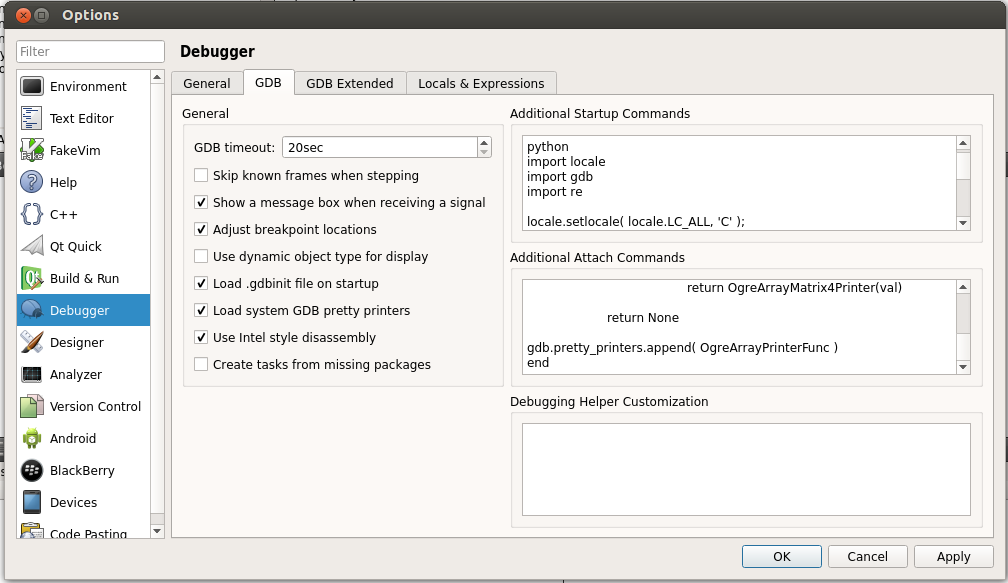
Copy paste the content of this file into both “Additional Startup Commands” and “Additional Attach Commands”; which is awesome, because I can use Qt Creator’s pretty printing along with the other IDEs having a different pretty printer config. If you don’t know what I’m talking about, here’s a screenshot:
Nemiver and Eclipse
Although they sucked hard, what worked “best” (which is still pretty bad) is the “strictly correct” children interface. Since someone might still find it useful, here it goes. Copy-paste the content into the .gdbinit file in your home folder and it should work. You may need to destroy and recreate your debugging project in Eclipse for changes to take effect.
Download section
I’ve wrapped them all in one tar.bz2 file. It’s under GPL3 license. DOWNLOAD LINK.
What’s next?
I’m going to stick with Qt Creator since it’s the most intuitive, while switching to KDevelop every now and then if it needs to. It’s bad that no debugging IDE I tried satisfied me. They work well for trivial stuff like watching the contents of an int, an array, or an std::vector. But once you go past that and need to debug complex data, there’s an obscene amount of effort you need to do compared with MSVC which just throws you exactly what you need to look at; and this complexity distracts you from the problem you’re trying to solve.
I don’t like the fact that I need three different gdbinit files for each IDE, because they don’t follow any sane convention.
If you dare to say that “true programmers don’t need to debug”, then grow up, learning from our mistakes is a part of our growth, and in my relatively short life I’ve been as far as debugging the compiler to spot it producing bad SIMD code. So, STFU.
Thanks allot for the config files! Should come in handy and save me a good chunk of time should I spend some time in those IDEs.
I have basically made my own IDE in Emacs from a dozen or more components and completely forgot about how much effort it took to achieve GDB prettification until I read this post. Now in 2013 there are a couple Emacs packages that come pre-configured for GDB prettiness, but that wasn’t much help to me in 2010 when I was constructing my environment.
I agree that for handling complex data structure contents, GDB falls short. Have you tried printing a std::vector using GDB? What should be incredibly simple is a PITA. Little things like this make me pine for either a rewrite or an alternative. Work really needs to be done within GDB so that we no longer have to make wrappers upon wrappers to get a practically usable product.
Oh, and anyone who says real programmers don’t need a debugger have apparently never dealt with 1) code by other people, 2) code bases too large for the human mind to fully grasp all at once, 3) simple human fallibility. In other words, they either have almost no real programming experience or are egotistical hermits.
Did you try out NetBeans?
That is what we use for C++ development on both Windows and Linux (and probably also Mac).
It’s really a great IDE.
I also like Qt Creator, but only for writing Qt applications. IMO, setting it up to do something else is extremely complicated, with no way to do things in the IDE, only being able to type in the pro file, which has no good documentation.
I have never used .pro files and know nothing of them. I have made the smoothest experience of using Qt Creator with any project described with CMake – you just load the root CMakeLists.txt into Qt Creator, and in a few seconds, your project is up. Bonus: CMake will make you a Visual Studio project and an XCode project too, and while no cross plattform build solution is without issues, this is amazingly workable. I certainly don’t want to maintain as many de-facto build systems as there are IDEs for various plattforms! Issues would take no end. CMake and other project-generation solutions akin to it are indeed the way forward for any project that is developed by more than one person, or hopes to attract volunteers in the future.
I work with Code::Blocks quite a bit and have written code for various components (though, I admit to only being a mediocre programmer myself). If you don’t mind, could you elaborate on your most desired features/greatest annoyances of the debugger?